Is your camera’s histogram still a mystery to you? Here is everything you need to know to read a histogram and how it will benefit you as a photographer.
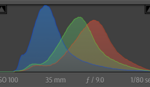
In the age of digital photography, the ability to view an image immediately on your camera’s LCD screen has caused the histogram to become increasingly irrelevant. But is there something that this graph can tell you that a preview of your image can’t? You can find an excellent explanation of this in the video above from Chris Nicholas of Becki & Chris. In this video, Nicholas breaks down an image to show you how to read a histogram and what it can tell you about your photo's exposure as well as its color.
While there is an argument to be made about the ease of only using your LCD to judge the exposure of an image, there are two immediate benefits to understanding your histogram as well. First, is that regarding exposure, your histogram is more trustworthy than the screen on your camera. It will give you more reliable information and will save you on a bright day when it’s difficult to view the image on your camera. Second, is that understanding a histogram is the foundation for using your editing software’s tone curve, one of the most powerful tools you own to manipulate your photos.
For both shooting and editing, a histogram is one of the most valuable tools you own, and having a proper understanding of it can benefit you immensely. If you want to learn more about how to use it, the video above will give you all the information you need to get started.
Lead image by Pixabay user JESHOOTScom, used under Creative Commons.