
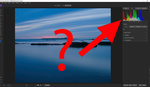
We all know how a histogram has to be read, or at least we should know. It is a handy tool to check if the exposure of the image is correct, or as correct as possible. If the image is not exposed correctly we can read the luminance histogram on our camera LCD screen and know exactly how much the exposure needs to be corrected. Well, perhaps not exactly, but enough to prevent us from guessing.
But first a little reminder for those who have difficulties reading a luminance histogram. It shows the distribution of luminance values in the image. At the utmost left the amount of completely black pixels is shown, at the utmost right we see the amount of completely white pixels. In between are the 256 luminance values of the JPEG image. For each luminance value you can see how much pixels there are by looking at the height of the curve. Remember, even when you shoot RAW, the image on the LCD screen of the camera shows the histogram of a JPEG image. Always.
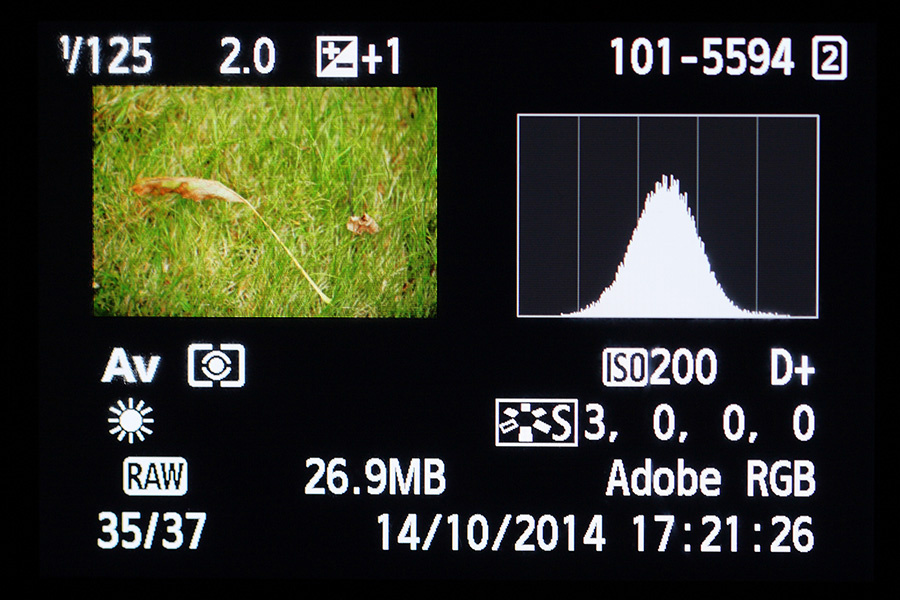
This image has a typical histogram. It has the theoretical perfect shape. Fortunately most histograms have different shapes. Reality learns us there is no perfect shape that fits all photographs
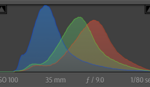
There is no correct histogram, no perfect shape. The shape, and thus distribution of the luminance values, depend not only on the exposure of the image, but also on the light situation and subject itself. If your subject has lots of darker tones, the histogram will be higher on the left side. If the subject has lots of lighter tones the histogram will be higher on the right side. A lot of contrast will show a peak at the left as well as the right side of the histogram, leaving not much in the way of midtones. Less contrast will show a peak in the middle of the histogram, with not much on the left and right side. Only midtones is also possible, with absolutely no bright and dark pixels nor completely white and black whatsoever. If you wonder when that is the case, just take a picture with fog or mist and look at the resulting histogram.
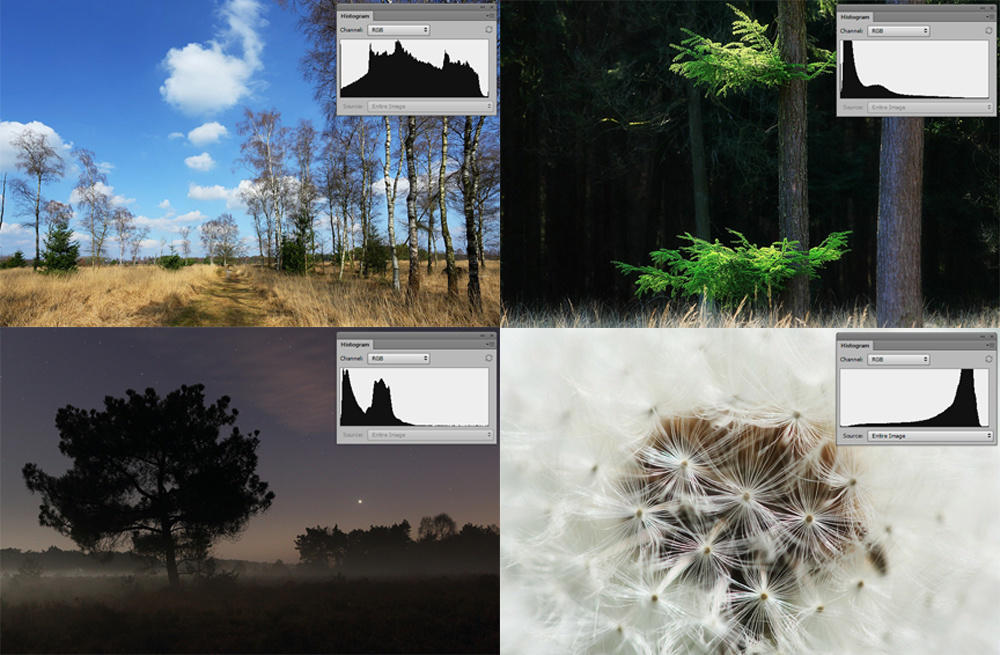
Just a few examples on how the histogram can be, depending on the subject and exposure.It shows the histogram can have completely different shapes, even if the exposure is correct.
Learning to read a histogram is nice, but most of the times we see the histogram only when we look at it in a photo editing program. In the favorable case we looked at it right after we took the picture, and those who use live view a lot or have a mirrorless camera, can see the histogram before the picture is taken. In any case, when we check the histogram we can correct an exposure when the histogram is not looking the way we want.
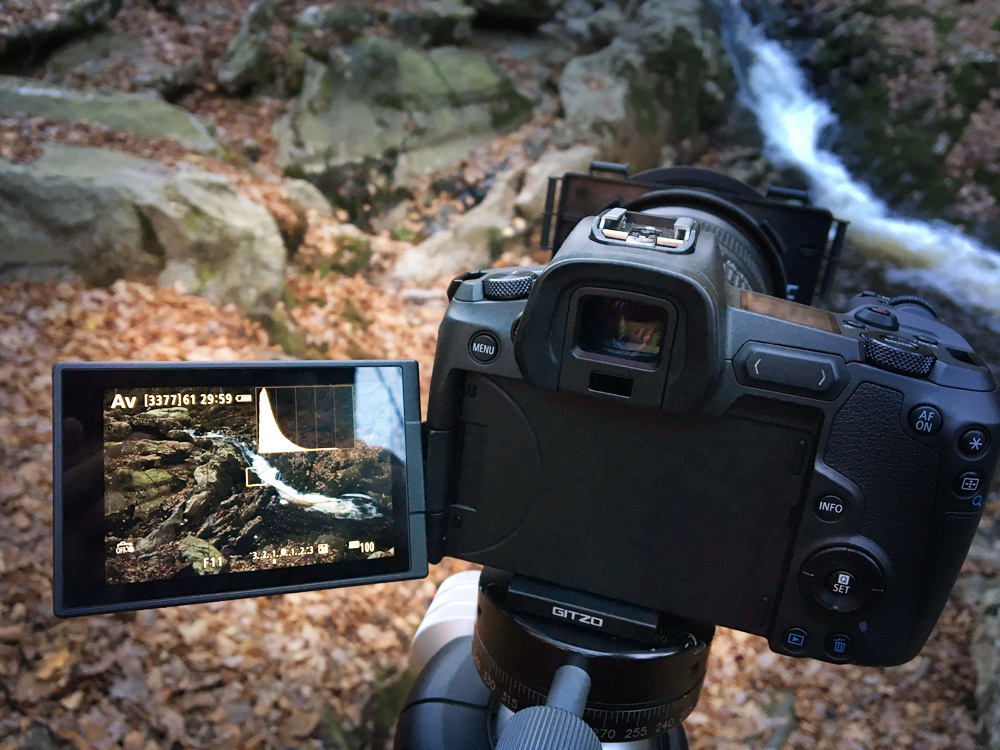
Showing the histogram in liveview or on the screen of a mirrorless camera can help determine the optimum exposure.
If you look really carefully at a histogram on the LCD screen on the back of the camera, we can see a couple of vertical dividing lines. Each of these line correspond with one stop. So, if we see a lot of empty space on either side of the histogram, we can read how many stops we must correct to get the wanted exposure, just by counting the amount of intersections between the lines.
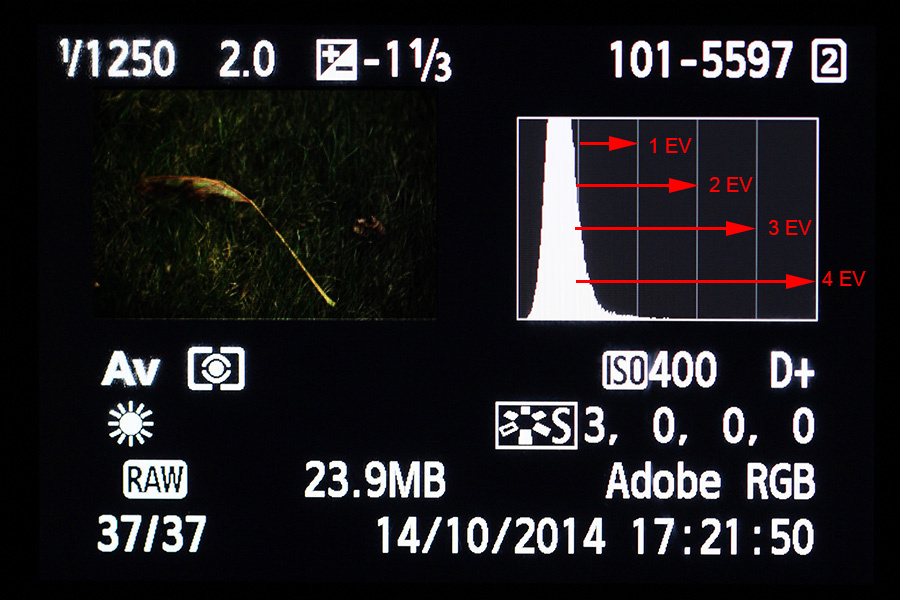
An underexposed image for illustration purposes. The lines in the histogram stands for the amount of stops. It is possible to determine how much stops the exposure needs to be corrected.
This can be very handy when you use the Exposure to the Right (ETTR) technique, for example. This way you know exactly how much you need to correct the exposure without guessing or trying. If you have a more traditional camera and without live view, you can make a test shot and correct the exposure when viewing the image of your LCD screen. When you use live view or a modern mirrorless camera it is possible to see the histogram before you take the picture, thus correcting it beforehand. This can be done even on the fly, because you see the histogram change when turning the dials.
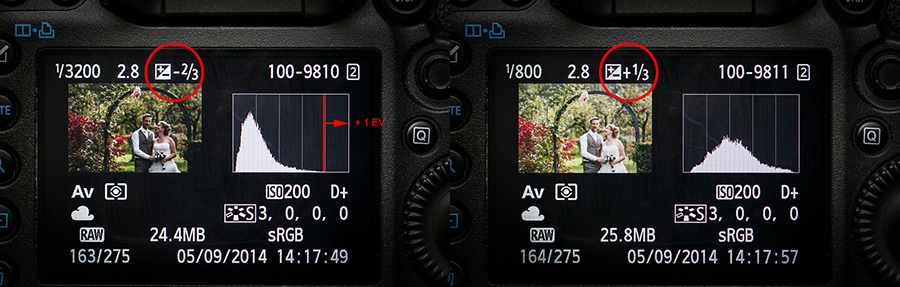
Although the exposure of the left image looks okay the histogram shows one stop room for improvement. By correcting the settings with one stop we end up with an optimum exposure. This is an example of how the histogram can be used to our advantage.
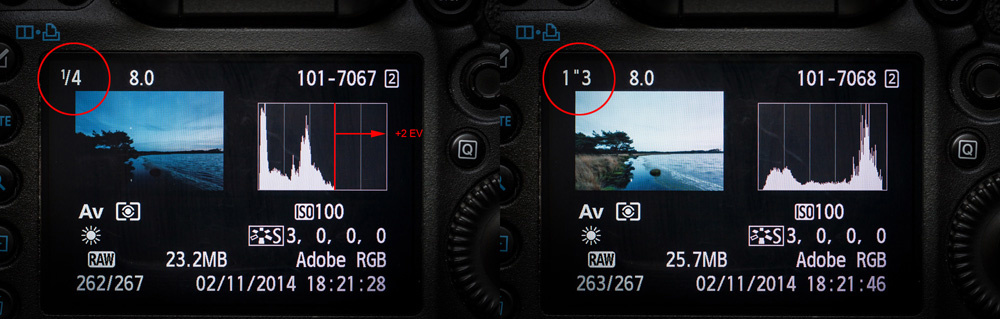
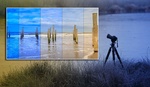
This landscape image during twilight at the left has an exposure for the sky. But the foreground is under exposed. By looking at the histogram we see room for a two stop correcting. Although the sky looks too bright, the highlights are within the dynamic range. This is Exposure To The Right (ETTR)
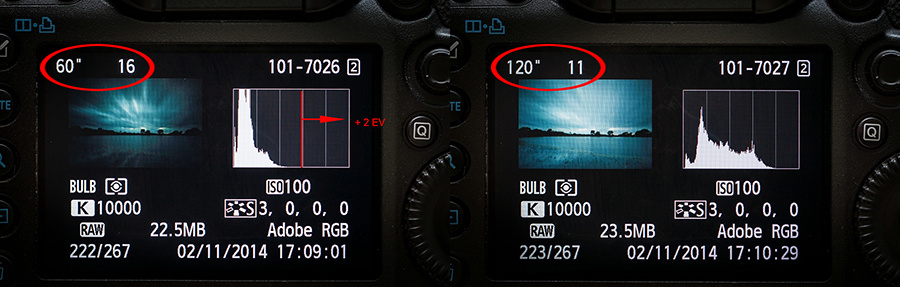
Using a ten stop neutral density filter can be tricky when determine the proper exposure time. The photo on the left is too dark and the histogram shows there is an improvement of two stops possible. Reading the histogram makes it possible to correct this without guessing.
The lines in the histogram can not only be used with normal exposure correction, but also with flash photography. As you may know, flash exposure on your subject and exposure of the ambient light are two different settings that can be changed almost independently of each other. When taking a picture with flashlight, you can use the histogram to read the flash exposure. If the flash exposure is too dark, you will see an empty space on the right side of the histogram. If the flash exposure is too bright, the empty space in the histogram is on the left side, of course. To correct this you need to change the flash exposure instead of the ambient exposure. By checking the histogram you have an easy way to set the flash exposure after only one test shot. You can use it for TTL flash with Flash Exposure Value (FEV) correction as well as manual flash setting.
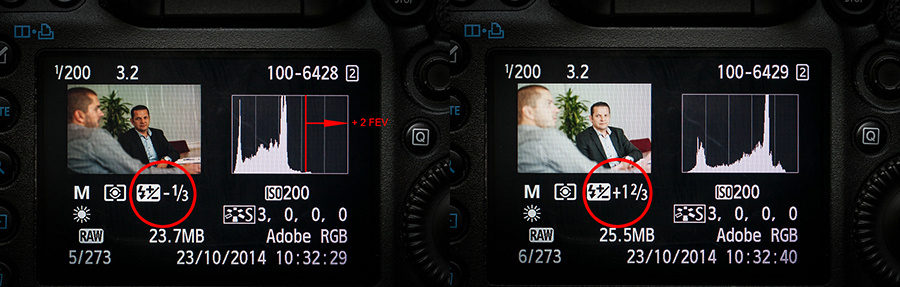
When using a flashgun you can use the histogram to correct the flash exposure instead of the ambient light. In this example with indirect TTL flash we see room for a two stop increment. By turning the Flash Exposure Value up with two stops we have a correct flash exposure
By reading the histogram more carefully you can use it to your advantage in many ways. But always remember, it is the histogram of a JPEG image and should be treated as such. The dynamic range of nearly all cameras is larger than the histogram shows, but only when shooting raw. It also means it is not foolproof, but it gives a good idea how and how much to correct an image that has am incorrect exposure.
Let me know in the comments if you already use the histogram in this way to read exposure and if you use it in more ways to your advantage.


Have you experienced a change in perception between viewing the screen in bright sunlight and twilight with the same settings?
The experience I have with different mirrorless cameras is the difference it makes when the brightness is changed, so much that a good exposure can look under exposed or overexposed. But if the way you work works for you and the exposure is correct, then there should be no reason to change :)
My next post will be about the effect of the screen brightness on how the exposure can be interpret.
Am I missing something about the shutter speed values in the before/after examples of the wedding and the first landscape photographies? For the wedding photography, I understand that a one stop correction ((-2/3+1/3)= 1 stop) should give a shutter speed of 1/1600s instead of 1/800s (which is a two stop correction from 1/3200s) and for the first landscape photography a two stop correction sould give a shutter speed of 1" instead of 1"3 (which is a 2 and 1/3 correction). The difference in the landscape photography values is just 1/3 stop but in the case of the wedding photography, it's a full stop difference...Very good post by the way!
You are correct. Thanks for the remarks about that. You would expect 1/1600 indeed. I guess it due to a different place of measurement (although I doubt that), or perhaps the sun went behind a cloud in the 8 seconds between the two images (more probably)? I have no other explanation for that.
The 1/3 stop difference is not that much and not really noticeable in the histogram. That is the experience I have.