
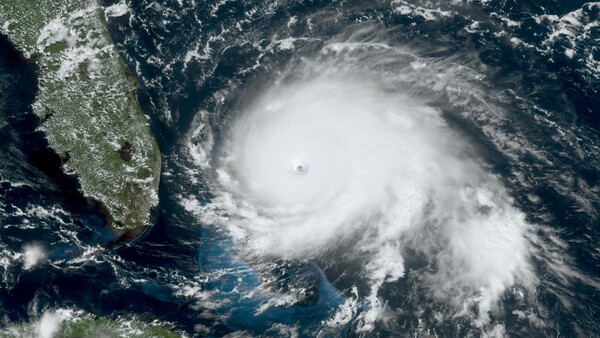
When a hurricane spins up over the Atlantic, the most frequent, most continuous pictures of it come from a camera parked 22,236 miles above the equator. That camera is the Advanced Baseline Imager, the primary instrument on NOAA's GOES-R series of weather satellites, and it works nothing like the one in your bag. It never racks focus, it has no shutter in the conventional sense, and what it delivers is not really a photograph. It is a stack of measurements that gets rebuilt into an image on the ground.
That difference runs deeper than it first appears. The familiar swirl of a hurricane you see on the news, the one with the crisp eye and the glowing cloud tops, is assembled from radiances gathered across sixteen separate wavelengths of light, most of them invisible to you. No single frame captures the whole thing. The satellite sweeps the scene strip by strip, and software stitches the numbers into something a human can read.
As a meteorologist, I spend a lot of time staring at these images, and the engineering behind them is genuinely strange and beautiful once you understand what you are looking at. Here is how a spacecraft the size of a small bus turns a distant storm into a picture, and why it can refresh that picture every sixty seconds when a hurricane is bearing down on the coast.
The Camera Sits 22,236 Miles Up and Never Looks Away
Everything about how these images work starts with the orbit. GOES is short for Geostationary Operational Environmental Satellite, and that word geostationary is the whole trick. At an altitude of roughly 22,236 miles, or about 35,786 kilometers, a satellite completes one lap of the planet in exactly the time the Earth takes to spin once. From the ground it appears to hang motionless over a single spot on the equator. The camera never has to chase its subject. It simply stares at the same hemisphere all day and all night.
That fixed vantage is what makes storm watching possible. A satellite in low orbit screams over a hurricane in a couple of minutes and does not come back for hours. A geostationary satellite holds the same spot in frame continuously, so it can watch a tropical wave organize off Africa, cross the Atlantic, and slam into the Gulf Coast without ever losing sight of it.
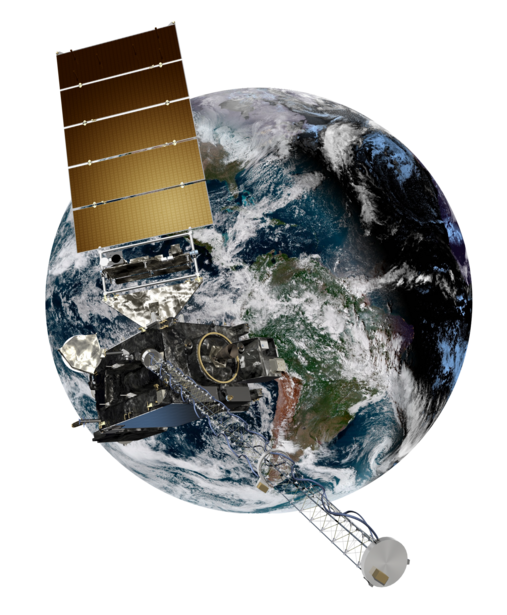
Two of these satellites cover the United States at any given time. GOES East watches the Atlantic and most of the country from 75.2 degrees west longitude, and GOES West covers the Pacific and the western states from 137 degrees west. The current lineup is the GOES-R series of four satellites: GOES-16, launched in November 2016, GOES-17, launched in March 2018, GOES-18, launched in March 2022, and GOES-19, the last of the series, which launched in June 2024 and became operational as GOES East in April 2025. Today, GOES-19 holds the East position and GOES-18 the West, with GOES-16 kept in orbit as a backup. The spacecraft themselves were built by Lockheed Martin, and the camera that does the imaging came from Harris Corporation, now L3Harris, in Fort Wayne, Indiana.
Sixteen Bands, Not One Picture
The Advanced Baseline Imager, or ABI, is where the real work happens. Compared to the previous generation of GOES cameras, which saw the world in just five spectral channels, the ABI sees in sixteen. Two of the sixteen see in visible light, four work in the near-infrared, and the other ten read the infrared. NOAA describes the jump as three times more spectral information, four times the spatial resolution, and more than five times the speed of the old system.
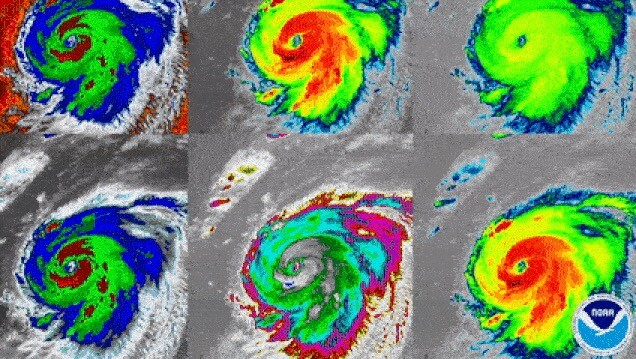
Each band is tuned to a specific slice of the electromagnetic spectrum, and each one tells you something different about a storm. Band 2, the red visible channel at 0.64 micrometers, is the sharpest, resolving detail down to half a kilometer. It shows the storm the way your eye would see it in daylight, all texture and shadow in the cloud tops. The near-infrared bands pick out things like cloud particle size and the difference between ice and liquid water. The infrared bands read temperature, and in a hurricane, temperature is almost everything.
Three of the sixteen bands are dedicated to water vapor alone, centered near 6.2, 6.9, and 7.3 micrometers. They map moisture at upper, middle, and lower levels of the atmosphere, and they work even where there are no clouds to see. This is how forecasters watch the dry air and the moisture streams that feed or starve a developing storm, invisible rivers of humidity that would never show up in a normal photograph. The clean longwave infrared window at 10.3 micrometers, band 13, measures the temperature of cloud tops, which is an important indicator of how tall and how powerful the thunderstorms inside a hurricane have grown. Colder tops generally mean higher, more violent convection.
A Satellite Image Is Built, Not Snapped
This is the part that surprises people. The ABI does not take a picture in the sense of opening a shutter and exposing a whole frame at once. It scans. Inside the instrument, two mirrors steer its view across the Earth, one sweeping east to west, the other stepping north to south. The camera reads a long thin strip of the planet, drops down, and reads the next one. Twenty-two of those sweeps stack together to build a full disk of the entire hemisphere.
What the detectors actually record is energy. Photons from the Earth strike the focal plane and generate an electrical charge proportional to how much light arrived. The electronics measure that charge and convert it to a number, a radiance value, for every band at every point in the scan. In the visible and near-infrared bands, that energy is sunlight reflected off cloud tops, which is why those channels go dark at night. In the infrared bands, the energy is thermal radiation emitted by the clouds and the surface themselves, so those bands keep working around the clock. That is why a hurricane can be tracked through the night, when there is no sunlight to reflect at all.
All of that raw radiance data streams down to ground stations, where the numbers become pixels. For the infrared bands, the radiances are run through the Planck equation and converted into brightness temperatures in kelvin, so a forecaster can read a cloud top's temperature straight off the image. The colorful hurricane views most people recognize go a step further. The most common one, called GeoColor, is a blend of five different ABI channels described in a 2020 paper by researchers at the Cooperative Institute for Research in the Atmosphere. During the day it approximates true color, and because the ABI has no green band, the green is simulated from a lookup table. At night the same product switches to infrared, painting high clouds white and low clouds and fog pale blue over a static backdrop of city lights. The image looks like a photograph. It is really a carefully constructed composite.
The satellite is not trying to make something beautiful. It is trying to make something measurable, and the beauty is a side effect of honest data.
One-Minute Eyes on a Storm
Speed is where the GOES-R series changed the game for hurricanes. In its default operating mode, the ABI produces a full-disk image of the hemisphere every ten minutes and a tighter view of the continental United States every five. That alone would be a big upgrade over the old satellites. The real weapon is the mesoscale sector.
A mesoscale sector is a roughly 1,000 by 1,000 kilometer box that the satellite can point anywhere it is told. The ABI refreshes each of its two mesoscale boxes once every sixty seconds, or it can pour all of that attention into a single box and update it every thirty seconds. During hurricane season, forecasters at the National Hurricane Center routinely park one of these boxes directly over the storm that matters most. The result is a near-live view, refreshed every minute and sometimes every thirty seconds, of a hurricane's eye tightening, its eyewall rebuilding, and its cloud tops cooling as it strengthens.
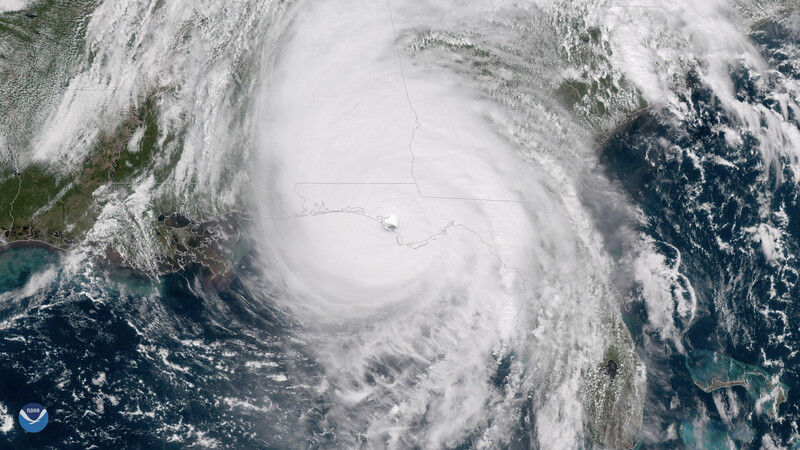
Hurricane Michael is the case I come back to. When it approached the Florida Panhandle in October 2018, GOES-16 tracked its entire life cycle in one-minute mesoscale imagery, and in some stretches at thirty-second intervals. The satellite watched Michael's eye clear and sharpen right up to the moment it came ashore near Mexico Beach on October 10. Post-storm analysis later upgraded Michael to a Category 5 at landfall, with estimated winds of 160 mph and a central pressure of 919 millibars, the third lowest ever recorded for a hurricane striking the United States. A year earlier, the same rapid imaging had captured Hurricane Harvey exploding from a tropical storm into a major hurricane over the Gulf in a matter of hours. Watching that intensification unfold minute by minute, rather than guessing at it between passes, is exactly the kind of thing that changes a forecast.
What the Bands Reveal That a Photo Cannot
Put the channels together and you get a portrait of a storm that no single-lens camera could ever produce. The visible bands show you the structure and the texture. The infrared window bands show you which parts of the storm are punching highest into the atmosphere, which is where the worst weather lives. The water vapor bands trace the moisture and the dry slots that decide whether a system grows or falls apart. Forecasters flip between them constantly, and often stack them into hybrid products, like the "sandwich" images that lay color-enhanced infrared over a visible base so you can see both the shape and the intensity at once.
The GOES-R satellites carry more than the imager, too. Each one flies a Geostationary Lightning Mapper that records lightning flashes across the hemisphere day and night. Researchers have tied bursts of lightning in a hurricane's eyewall to changes in its strength, so a spike on the lightning mapper can be an early hint that a storm is about to do something dramatic. Paired with the ABI's one-minute imagery, it gives forecasters a second, independent read on a storm's health.
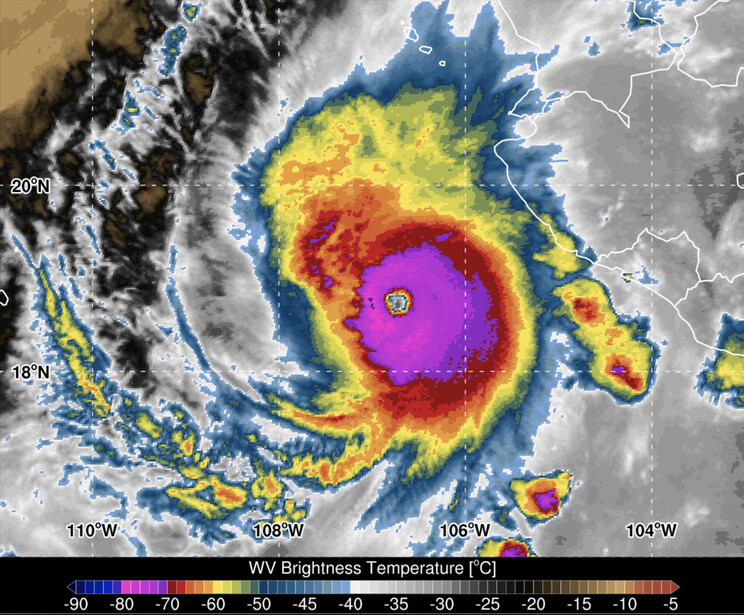
The next time a hurricane fills your screen with that eerie, perfect eye, remember that you are not looking at a snapshot. You are looking at a hemisphere's worth of energy, measured across sixteen wavelengths by a camera that has been holding perfectly still 22,236 miles overhead, rebuilt into a single frame in the seconds it took the storm to turn a little more.
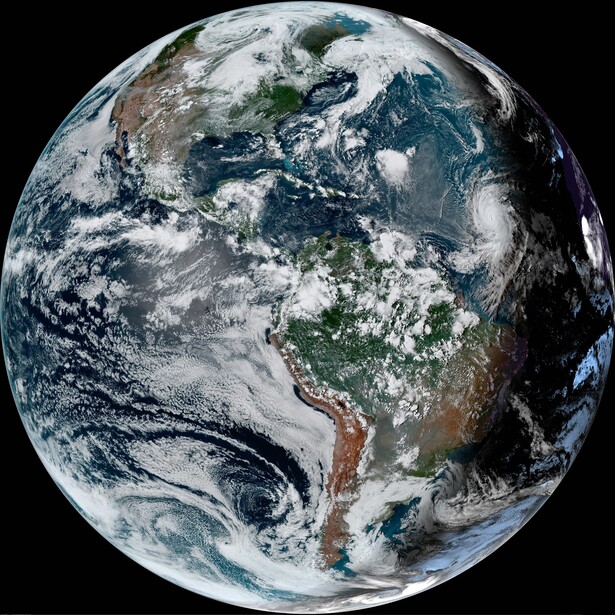
Lead image: a GOES-16 view of Hurricane Dorian's sharply defined eye east of Florida as it approached the Bahamas on September 1, 2019. Image by NOAA, public domain. Source.





.png)
.gif)


Join the Fstoppers community for free
-
Post comments and join in the discussions
-
Browse the site ad-free
-
Share your work and get featured in the community
-
Compete in the photo contests for fun and prizes
No comments yet