
One question I often get from my photography students is: "What the heck is that graph?" I often enjoy teaching photography even more than creating it, but explaining concepts like the histogram is one of the tougher parts of teaching photography.
Perhaps this little graph has been haunting you for some time, popping up here and there in your camera or sitting quietly in the corner of your Lightroom workspace. Or you might already be familiar with the histogram, but would like to learn more. In any case, let's first look at Webster's definition of a histogram: "a representation of a frequency distribution by means of rectangles whose widths represent class intervals and whose areas are proportional to the corresponding frequencies."
That definition couldn't be more obscure and technical-sounding (but that’s why we have photography teachers). To put it in simple terms, a histogram is a visual representation of an image's luminance content, shown as graphical data.
The luminance range of such data lies in its placement on the graph, left to right, or on its X axis. The left end of the histogram represents darker (shadow) data, and the right end represents the brighter (highlight) data. Naturally, the middle of the graph displays mid-tones. The amount of any specific luminance value is represented by the Y axis (up and down).
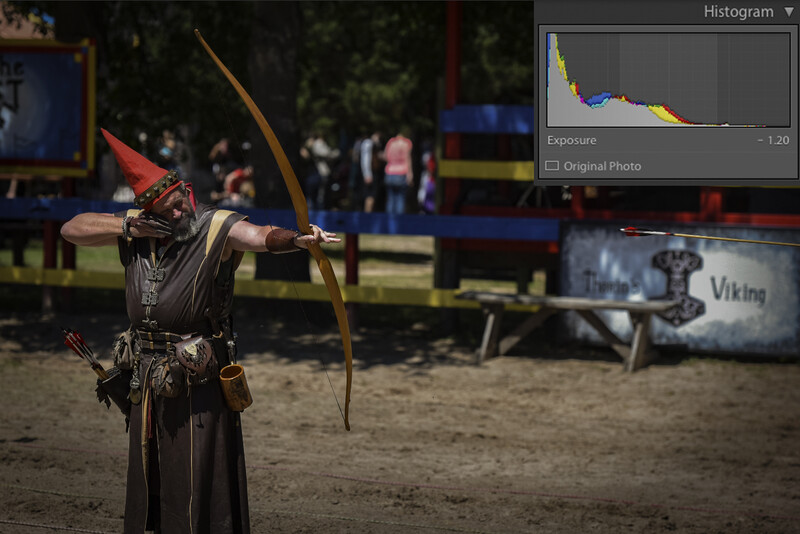
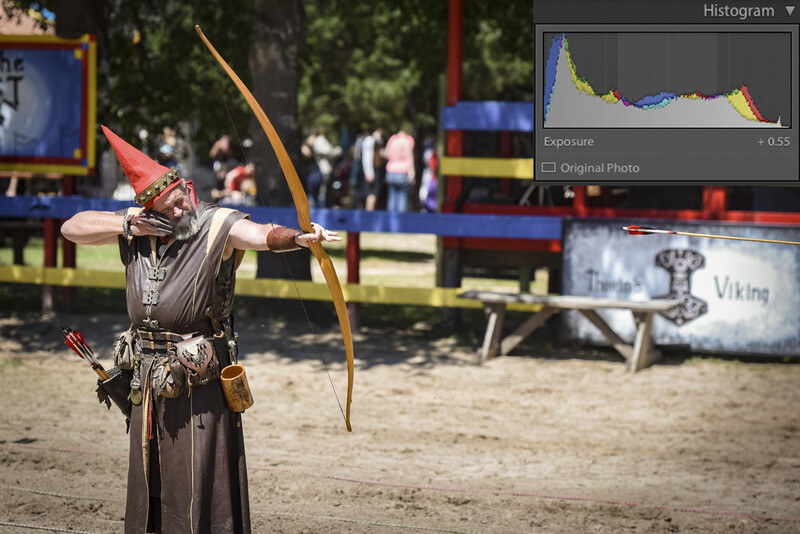
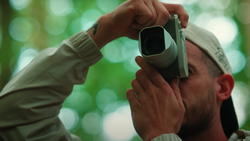
To make this abstract description more palpable, let's begin with an example. If you create a photo that's technically underexposed, the histogram might appear this way:
If you were to look at the above image's histogram on its own, you might think the image it represents is underexposed and lacking overall data. Actually, there’s nothing technically wrong with it. Photographic art is not always accurately represented by technical data, and sometimes, technical rules are purposefully broken for dramatic effect.
Clipping
Clipping on the histogram is seen as data touching the very end of either side of the X axis: the left (shadows) or right (highlights) end. This indicates a loss of data on either end of the luminance spectrum. Sometimes, clipping is less obvious, showing up as a thin sliver on the very end of a graph.
The good news is that with editing software like Lightroom, you can easily turn clipping indicators on, alerting you to any loss of data within a tonal range. The bad news is that, as I mentioned earlier, you can't recover this data.
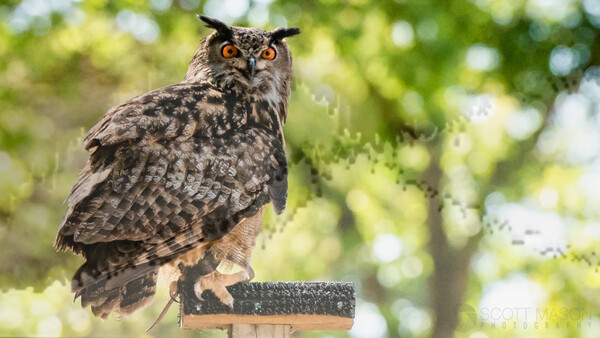
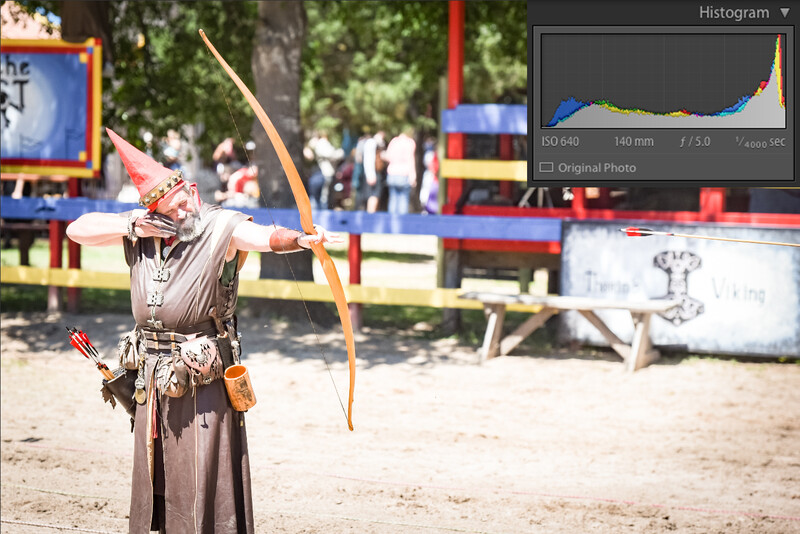
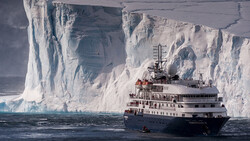
You can also use "highlight previews" found in your camera's playback menu, which will actively alert you (via blinking warning spots) to any highlight clipping while you're shooting.
The above image seemed to present a nice moment, and received a "pass" in my image culling process. However, we do observe highlight clipping here.
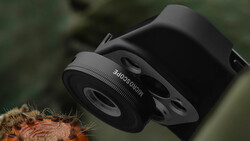
Example
As you edit, specifically, as you make global exposure adjustments (exposure, highlights, shadows, etc.), you will notice your histogram changing. These changes can be seen in real-time in the upper right-hand corner of Lightroom's Develop module.
An Ideal Histogram
While there is no "ideal" histogram for all situations, you ideally have most data centered in the mid-tones and not too much in the shadows or highlights or slightly skewed to the right. So, a healthy histogram will show up as a strong graph which shouldn't appear too "thin" or lacking in data, ideally centered around the middle with no data running off either end of the graph. Then again, rules can and will often be broken.
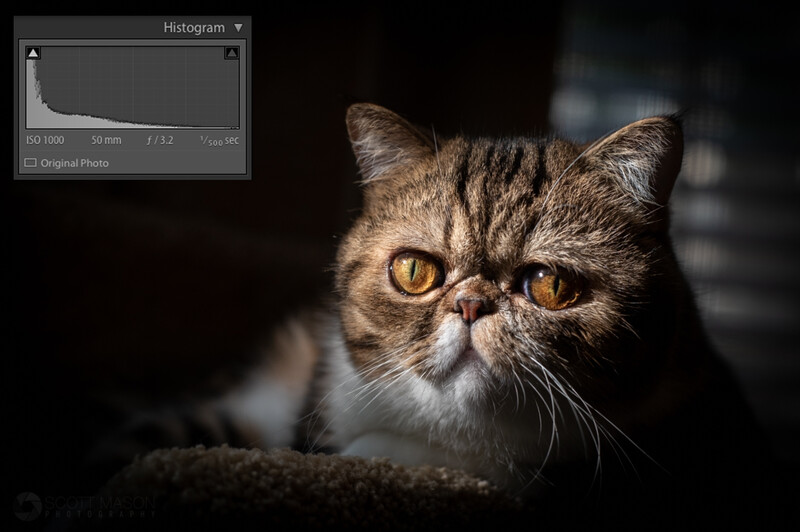
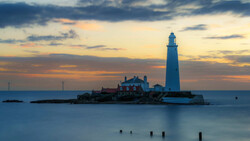
But unlike like the earlier example of the underexposed archer image, you could have an image that is intentionally dark or "low key." The histogram for this image might not look evenly distributed at all. A similarly uneven distribution is could be produced by bright, "high key" images. Such image production reflects legitimate stylistic preferences.
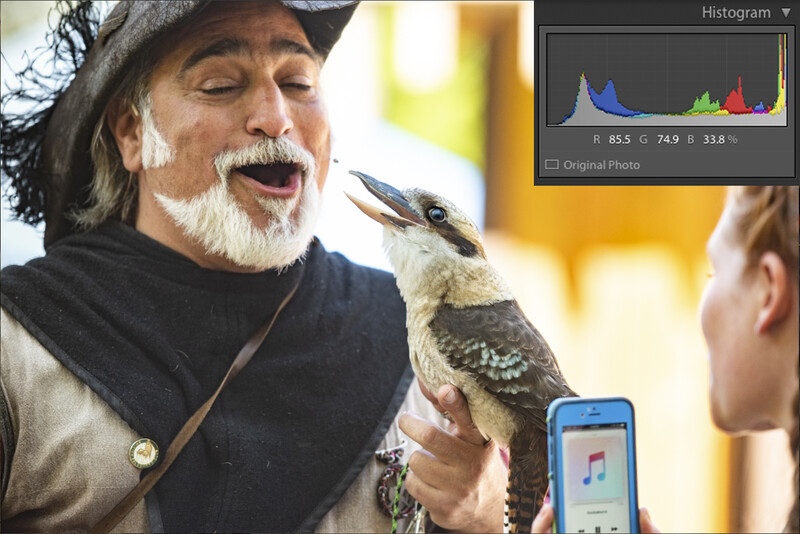
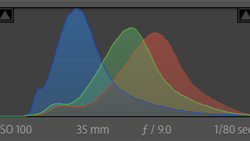
Color Histograms
Color histograms work similarly to an exposure (standard) histogram, but they show you where the data is in each color channel of R, G, and B. For a properly color-balanced photo, you'll want a mostly consistent peak in each color channel. Lightroom integrates the color histogram in the same dialogue as the the exposure histogram. All are shown together as one graph in the upper right corner of the Develop module.
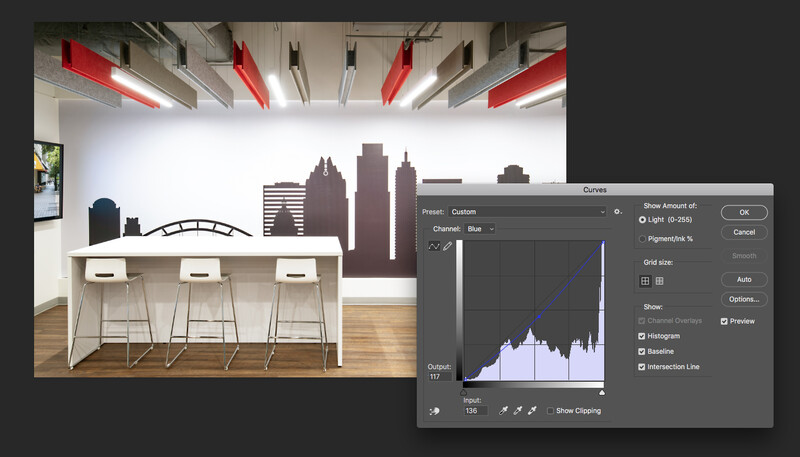
In Photoshop, each of the three RGB channels can be manipulated separately. To do this, use the keyboard shortcut Command + M to bring up your Curves adjustments. Under "Channel" on the Curves adjustments box, select any of the three color channels to view each channel's histogram, and then, manipulate each separate channel to achieve color balance.
If one of the color channels looks different from the rest, it's possible you need an adjustment. I use the Color Curves technique described above fairly often as a shortcut in my color editing, especially when I've identified a single layer that needs color adjustment. Instead of going into the raw slider module to change the white balance, I simply use the Command + M keyboard shortcut and drag the color channels around until they're where I need them.
Summary
Even if you can judge an exposure with your bare eyes, histograms can still be a valuable tool in identifying your exposure and even color data. Histograms can help you to detect data-clipping or peaking. If you're all about maximizing tonal ranges, it would benefit you to attention to your histograms, at least when the occasion calls for it. You can also utilize the Highlight Preview function on your camera and the other built-in Adobe features to make sure you're maximizing your images.
Do you utilize histograms? If so, in what ways have they helped you? Please share your comments below.
If you're passionate about taking your photography to the next level but aren't sure where to dive in, check out the Well-Rounded Photographer tutorial where you can learn eight different genres of photography in one place. If you purchase it now, or any of our other tutorials, you can save a 15% by using "ARTICLE" at checkout.
Join the Fstoppers community for free
-
Post comments and join in the discussions
-
Browse the site ad-free
-
Share your work and get featured in the community
-
Compete in the photo contests for fun and prizes
27 Comments
Histogram shistogram. Don't need it when you have 14+ stops of dynamic range :) Kidding. Live view/evf and cliping does enough for me though. I occasionally check the hista.
No camera have 14+ stops of dynamic range that is Usable..
It's the job of the editor to make those stops useable. You'd usually only see say 8 stops on an unprocessed RAW.
real World dynamic range is like 8 stops not 14 stop.. lab shoots is like 14 stops..
Is it bad of me to say that I never use the Histogram? Like, really, have never used it.
I'm not trying to humblebrag or anything at all here, it's just never been something I felt the need to use. I know others swear by it, I just look at the image and go on feeling. Working in this game since 2006 and it's worked so far.
Interesting to read about it though.
I'm forever feeling like a fraud, I never use a histogram while shooting, or a light meter. Am I doing photography 'wrong'?
When crossing a street, do you consciously calculate the oncoming cars' speed or can you intuitively sense if you should stop or go?
A very good analogy. I think it'd a personal issue I have with wanted to do things 'correctly' I'm realising more as I get older that with art there is no 'correctly'.
In my opinion, Rob, it's fine that you don't use it. I think that with an understanding of exposure and the right eye while reviewing in the field or edit space, you can get by just fine without histograms.
A decent basic primer though the statement regarding apparent "clipping" on a histogram does not necessarily mean that the data is unrecoverable. If the file is a .jpg, then that is reasonably accurate, however RAW files may allow for greater highlight recovery.
Absolutely. An optimally exposed raw file will likely show JPEG clipping.
The reason for that is that histograms are based upon the embedded JPEG even in raw files. So, there is always a little more there than the histogram shows. The picture on the LCD is also an embedded JPEG even on raw files.
Yes, I'm aware of that. It's why applications like Rawdigger exist. It would be nice to have the JPEG representation on the LCD, but at the same time be able to have a raw histogram.
I had not heard of Rawdigger. I checked it out and purchased it. Thanks for bringing that up!
It's a great tool to help understand where you can go with the on camera histogram in relation to the raw files you produce; how far up that right side you can go before it's actually clipping in the raw file for example. For ETTR it's quite useful. For a landscape shooter like you--by the way, very nice work in your portfolio--it could be especially useful.
Thanks....
i only use them for low-key landscape scenes to ensure i'm not losing data in the shadows that i can recover later. after that, i use it during culling to drop images that are clipped high or low that won't fit my vision in post processing.
no use wasting my time trying to recover shadows or highlights that don't exist.
in the viewfinder, i rely more on blinkies, especially if there's a time constraint.
Optimum exposure for raw is different than that for JPEG. Generally, an optimally exposed raw file will appear to be over exposed or have a heavily right-leaning histogram because the histograms are based on JPEG files.
The obvious answer, of course, is a raw histogram. Something I'm not sure why major manufacturers haven't yet provided us. A raw histogram would be quite useful in ensuring that we utilize our sensors to their fullest capacity.
Probably because a raw histogram would be too processor-intensive?
Possibly, I don't know. Processing power is pretty cheap these days, though.
Just bracket the heck out of everything and you get all the detail you need. Most cameras (and cell phones) do HDR right on board.
...Or bracket the heck out of everything and adjust in post.
I have no problem understanding histograms, until I read the Webster definition
From the above histogram definition:
"The amount of any specific luminance value is represented by the Y axis (up and down)."
Huh?
Do Artemis and Will know you're using their images? :-D
Ha ha. I don't have their contact info, but please send this article along to them! Assuming one of those isn't the bird. ;)
Reading the title, I was thinking "There is no one correct way the histogram should look!". Happy to read through the article and see that the histogram was well explained with good examples, and that the author qualified his statement as well on how it could be different.
The histogram is just another tool in the toolbox, using it or not in my opinion does not necessarily mean the image is good or bad. I find it helpful in some cases, and glad I have it to use.